-By Nishant Chaturvedi
India’s Foreign Trade Since 1991: Trends and Directions
Abstract- India’s foreign trade has changed significantly in the last 32 years. According to the HS6 digit level, 3,837 products were exported to 173 countries and 3,391 products were imported from 123 countries. The top exported commodities in 1991 were gems and jewelry, non-agglomerated iron ores, Petroleum products, and textiles. This paper examines India’s foreign trade since the country opened its economy in 1991. The paper also analyses how globalization, new technology, and global demand shifts have affected India’s Trade. It analyses the problems Indian exporters have, these involve competition, trade restrictions, and supply chain. It further advises various means to augment exports such as diversification and quality and to focus on technologically advanced products such as artificial intelligence products and e-products.
Keywords – Globalization, Competition, Diversification.
Introduction- In the 1990s due to a closed economy and lack of competition, India’s commodities were less expressive and the price of goods in India was higher than in the rest of the countries in the world, but the new policies of liberalization, privatisation, and globalisation opened the door of possibilities and opportunities In 1991–1992, the government of India introduced a series of reforms (structural reforms and stabilization reforms) like deregulation of industrial sectors, financial sector reforms, tax and tariff reforms, foreign exchange and foreign investment reforms, and trade and investment reforms. The economic reforms of 1991 (openness of the economy, transparency, and ease of doing business) have prompted the integration of the Indian economy with the world, and due to economic integration and globalization, the importance of foreign trade in India has increased rapidly. Due to having the second highest population (Census 2011) in the world, it has emerged as an attractive, new, and one of the biggest markets in the world. In 1991, the total value of India’s exports was just 17.9 million USD, and the value of imports was 19.5 million USD. In 1991, India’s top five export items were gems and jewellery, iron ore, petroleum products, frozen shrimp and prawns, and textiles. The main imports included crude oil, raw diamonds, and fertilizers. But in 2024, India’s total exports during April- October 2024* are estimated at USD 468.27 Billion registering a positive growth of 7.28 per cent, and total imports during April- October 2024* are estimated at USD 531.51 Billion registering a growth of 7.05 per cent. China has emerged as India’s largest trading partner with $118.4 billion of two-way commerce in 2023-24 edging past the U.S. Over the past 32 years, India’s trade composition has changed significantly. In 2024, the top exports include Petroleum products, telecom instruments, drug formulations, gems, and jewellery. The top imports include crude oil, gold, coal, petroleum products, and electronic items. India’s foreign trade has grown over 3000% in 32 years, increasing from $22.94 billion in 1991 to $759.93 billion in 2023.
Objective
To study India’s Foreign Trade Composition Since 1991.
Data Source –
This study is based on secondary data from the government and other reliable sources, such as the Ministry of Statistics and Programme Implementation (MoSPI), the Ministry of Commerce and Industry, the Reserve Bank of India (RBI), and others. Data has been represented using tables, graphs, charts, etc.
The volume of Trade Since 1991-
India’s foreign trade has changed a lot since 1991, with periods of growth and challenges. In the pre-liberalization period (1990-91 to 1991-92), trade was limited, with exports at ₹32,558 crore and imports at ₹43,193 crore, totalling ₹75,751 crore. This was due to trade restrictions and less access to global markets. After the 1991 economic reforms, India entered a post-reform growth phase (1992-93 to 2000-01), with rapid trade expansion. Exports grew from ₹44,042 crore to ₹203,571 crore, and imports from ₹47,851 crore to ₹230,873 crore, bringing total trade to ₹4,34,444 crore. This was the start of India’s global integration. From 2001-02 to 2007-08, India became a major player in global trade. Exports rose sharply from ₹209,018 crore to ₹6,55,864 crore, and imports grew from ₹2,45,200 crore to ₹10,12,312 crore. Key industries like IT, textiles, and engineering helped drive this growth. The Global Financial Crisis (2008-09 to 2012-13) slowed trade briefly, but India bounced back. Exports reached ₹16,34,318 crore by 2012-13, and imports grew to ₹26,69,162 crore, mainly for oil and gold. From 2013-14 to 2016-17, India saw slower trade growth, with exports at ₹19,05,011 crore and imports at ₹27,15,434 crore, leading to a trade deficit where imports exceeded exports. India’s trade reached record highs from 2017-18 to 2019-20. Exports hit ₹2,307,726 crore in 2018-19, and imports were ₹35,94,675 crore, showing India’s increasing role in global trade. Finally, the COVID-19 pandemic in 2020 caused a dip in trade. Exports fell to ₹21,54,339 crore, and imports decreased to ₹29,09,937 crore, totalling ₹50,64,276 crore due to supply chain disruptions and global lockdowns. We have done well after the COVID-19. Exports grew from ₹21,54,339 crore to ₹36,21,550 crore in 2022-23. Petroleum products, electronic goods, and textiles are the topmost export contributors. In 2023-24, exports are around ₹63,63,200 crores.

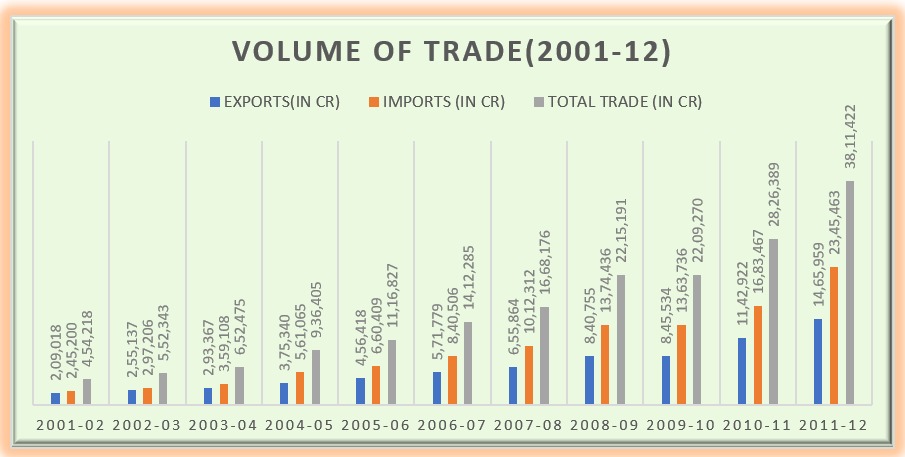
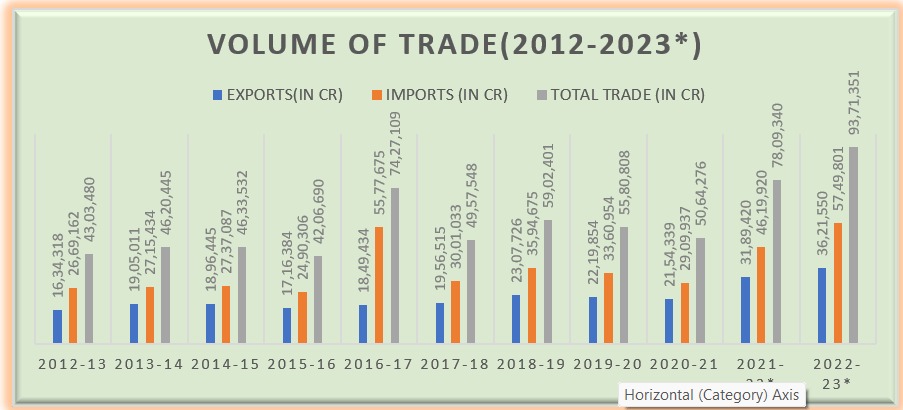
(SOURCE – RBI, ECONOMIC SURVEY, PIB)
Direction of Trade-
The table below shows the direction of India’s foreign trade from 2021-22. This data indicates that the major sources of Indian imports and major destinations of Indian exports are worldwide. It is visible from the data that both import-export values have increased continuously from all the country groups. India’s trade has experienced considerable diversification in its markets. Regionally, India’s exports to Europe and America declined, and exports to Africa and West Asia have increased. The data indicates that the major sources of India’s exports are West Asia and OPEC Countries followed by the European Union. Petroleum products are the main factor placing this group at the top of the list.
| India’s Import by Region (Value in US$ Million) | |||||
| Region | April- January, 2021-22 | % Share | April-January, 2022-23 | % Share | % Change |
| 1) Europe | 72,243.58 | 14.62 | 73,311.34 | 12.17 | 1.48 |
| 1) EU Countries | 42,380.38 | 8.58 | 48,219.71 | 8.01 | 13.78 |
| 1.1) European Free Trade Association (EFTA) | 22,206.61 | 4.49 | 13,692.01 | 2.27 | -38.34 |
| 1.3 Other European Countries | 7,656.59 | 1.55 | 11,399.62 | 1.89 | 48.89 |
| 2) Africa | 39460.86 | 7.99 | 41018.57 | 6.81 | 3.95 |
| 2.1Southern African Customs Union (SACU) | 9,890.77 | 2.00 | 9,497.72 | 1.58 | -3.97 |
| 2.2 Other South African Countries | 3,618.44 | 0.73 | 5,383.97 | 0.89 | 48.79 |
| 2.3 West Africa | 17,476.12 | 3.54 | 16,440.07 | 2.73 | -5.93 |
| 2.4 Central Africa | 200.53 | 0.04 | 499.62 | 0.08 | 149.15 |
| 2.5 East Africa | 2,201.34 | 0.45 | 2,622.03 | 0.44 | 19.11 |
| 2.6 North Africa | 6,073.66 | 1.23 | 6,575.16 | 1.09 | 8.26 |
| 3) America | 58994.11 | 11.94 | 68982.51 | 11.46 | 16.93 |
| 3.1 North America | 40,435.76 | 8.18 | 49,918.92 | 8.29 | 23.45 |
| 3.2 Latin America | 18,558.35 | 3.76 | 19,063.59 | 3.17 | 2.72 |
| 4) Asia | 312303.12 | 63.21 | 379664.69 | 63.05 | 21.57 |
| 4.1 East Asia (Oceania) | 14,173.46 | 2.87 | 17,080.38 | 2.84 | 20.51 |
| 4.2 ASEAN | 54,328.93 | 11.00 | 74,877.95 | 12.43 | 37.82 |
| 4.3 West Asia- GCC | 86,722.32 | 17.55 | 112,152.79 | 18.63 | 29.32 |
| 4.4 Other West Asia | 28,336.33 | 5.74 | 34,308.21 | 5.70 | 21.07 |
| 4.5 NE Asia | 124,047.84 | 25.11 | 136,665.92 | 22.70 | 10.17 |
| 4.6 South Asia | 4,694.24 | 0.95 | 4,579.44 | 0.76 | -2.45 |
| 5) CIS & Baltics | 10983.37 | 2.22 | 38917.65 | 6.46 | 254.33 |
| 5.1 CARs Countries | 336.92 | 0.07 | 330.06 | 0.05 | -2.04 |
| 5.2 Other CIS Countries | 10646.45 | 2.15 | 38587.59 | 6.41 | 262.45 |
| 6) Unspecified Region | 78.06 | 0.02 | 262.89 | 0.04 | 236.78 |
| India’s Total Import | 494,063.10 | 100.00 | 602,157.65 | 100.00 | 21.88 |
| India’s Export by Region
(Value in US$ Million) |
|||||
| Region | April- January, 2021-22 | % Share | April-January, 2022-23 | % Share | % Change |
| Europe | 67,764.97 | 19.91 | 80,021.37 | 21.51 | 18.09 |
| 1) EU Countries | 50,657.22 | 14.89 | 60,694.51 | 16.31 | 19.81 |
| 1.1) European Free Trade Association (EFTA) | 1,456.24 | 0.43 | 1,573.48 | 0.42 | 8.05 |
| 1.3 Other European Countries | 15,651.51 | 4.60 | 17,753.38 | 4.77 | 13.43 |
| 2) Africa | 32035.39 | 9.41 | 42427.18 | 11.40 | 32.44 |
| 2.1Southern African Customs Union (SACU) | 5,278.13 | 1.55 | 7,695.95 | 2.07 | 45.81 |
| 2.2 Other South African Countries | 2,443.46 | 0.72 | 3,054.25 | 0.82 | 25.00 |
| 2.3 West Africa | 10,884.16 | 3.20 | 14,741.40 | 3.96 | 35.44 |
| 2.4 Central Africa | 1,386.20 | 0.41 | 1,302.76 | 0.35 | -6.02 |
| 2.5 East Africa | 6,399.15 | 1.88 | 8861.02 | 2.38 | 38.47 |
| 2.6 North Africa | 5,644.29 | 1.66 | 6771.80 | 1.82 | 19.98 |
| 3) America | 81261.79 | 23.88 | 88335.70 | 23.74 | 8.71 |
| 3.1 North America | 68,935.54 | 20.26 | 73,282.43 | 19.70 | 6.31 |
| 3.2 Latin America | 12,326.25 | 3.62 | 15,053.27 | 4.05 | 22.12 |
| 4) Asia | 153737.03 | 45.18 | 154246.27 | 41.46 | 0.33 |
| 4.1 East Asia (Oceania) | 6,869.19 | 2.02 | 6,686.88 | 1.80 | -2.65 |
| 4.2 ASEAN | 34,438.70 | 10.120 | 36,302.18 | 9.76 | 5.41 |
| 4.3 West Asia- GCC | 34,859.18 | 10.24 | 42,164.03 | 11.33 | 20.96 |
| 4.4 Other West Asia | 8,531.47 | 2.51 | 13,494.54 | 3.63 | 58.17 |
| 4.5 NE Asia | 41,418.09 | 12.17 | 32,529.05 | 8.74 | -21.46 |
| 4.6 South Asia | 27,620.40 | 8.12 | 23,069.59 | 6.20 | 16.48 |
| 5) CIS & Baltics | 4080.87 | 1.20 | 3782.22 | 1.02 | -7.32 |
| 5.1 CARs Countries | 548.51 | 0.16 | 781.79 | 0.21 | 42.53 |
| 5.2 Other CIS Countries | 3532.36 | 1.04 | 3000.43 | 0.81 | -15.06 |
| 6) Unspecified Region | 1396.63 | 0.41 | 3252.3 | 0.87 | 132.87 |
| India’s Total Export | 340,276.68 | 100.00 | 372,065.04 | 100.00 | 9.34 |
(Source- Government of India Ministry of Commerce and Industry Department of Commerce)
(SOURCE- DIRECTORATE GENERAL OF FOREIGN TRADE)
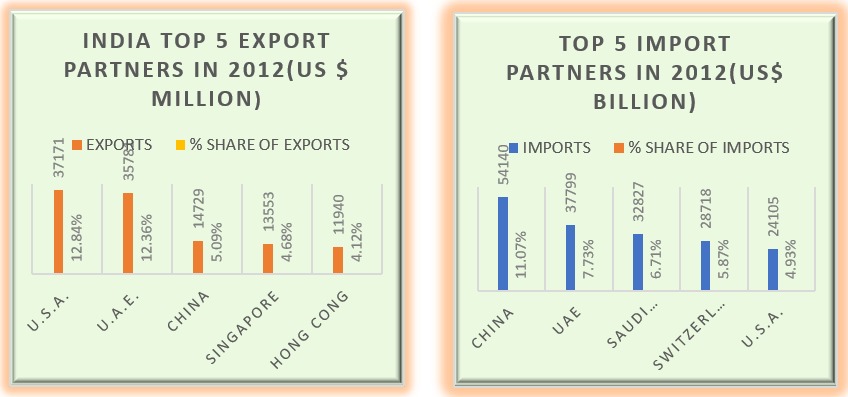
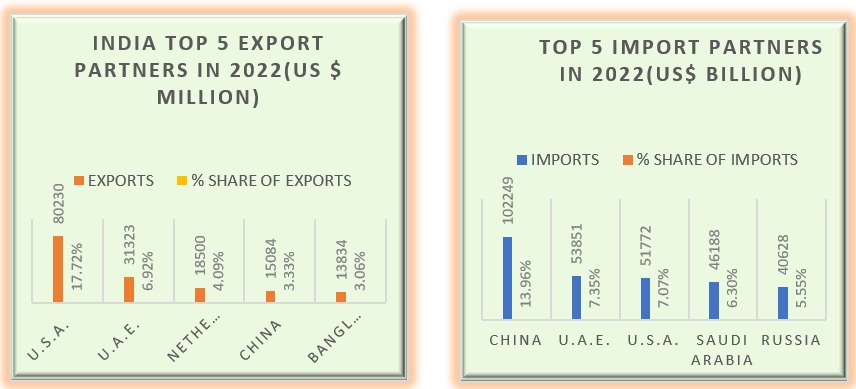
India’s trade has changed dramatically from 1992 to 2022. The U.S.A. emerged as the most significant partner across the year. Exports to the USA have grown continuously from 1992 to 2022. In 1992, the value of exports was 3929 million dollars, which increased to 37171 million in 2012 and 2022, this value increased to 80230 million dollars and is still in 2024, the topmost export partner of India. Our dependence on China for imports has been growing over time. Imports from China have increased almost 2 times in the last 10 years. while UAE consistently featured as a key partner in imports and exports, reflecting strong ties in trade and energy. As per the HS6 digit level, we are exporting more than 4400 products to 223 countries and importing 4316 products from 211 countries.
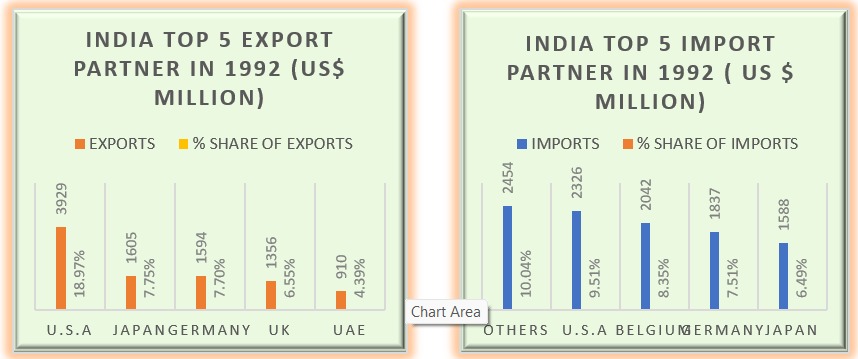
(SOURCE – WORLD INTEGRATED TRADE SOLUTIONS(WITS))
(Source – HS6 digit level)
India’s Trade Performance
India has released its latest trade data, forecasting that export figures will sustain the peak achieved in the previous year, reaching an estimated US$776.68 billion in the fiscal year (FY) 2023–24, slightly surpassing the US$776.40 billion recorded in the preceding fiscal year. According to the Ministry of Commerce and Industry, FY24 concluded with the highest monthly merchandise exports of the fiscal year, totalling US$41.68 billion in March 2024.
Total goods imports by India in 2023–24 decreased by 5.66 per cent to US$675.44 billion.
| Export / Import | 2023-24 (US$ billion) | 2022-23 (US$ billion) | |
| Merchandise | Export 437.06 437.06
|
||
| Import 677.24 751.97
|
|||
| Services | Export 339.62 325.33
|
||
| Import 177.56 182.05
|
|||
| Overall Trade
(Merchandise + Service )* |
Export 776.68 776.40
Import 854.80 898.01
|
||
| Trade balance -78.12 -121.62 | |||
(Source – Ministry of Commerce and Industry)
Trends and Performance of India’s Merchandise Trade
| (Value in US$ Billions) | |||||
| Years | Export | % Change | Import | % Change | Trade Balance |
| 2017-18 | 303.53 | —- | 465.58 | —- | -162.06 |
| 2018-19 | 330.07 | 8.75 | 514.03 | 10.41 | -183.96 |
| 2019-20 | 313.36 | -5.06 | 414.71 | -7.66 | -161.35 |
| 2020-21 | 291.81 | -6.88 | 394.44 | -16.92 | -102.63 |
| 2021-22 | 422.00 | 44.58 | 613.05 | 55.31 | -190.72 |
| 2022-23 | 450.43 | 6.74 | 714.04 | 16.47 | -263.61 |
| 2022-23(April-July) | 159.32 | —- | 247.31 | —- | -87.99 |
| 2023-24(April- July) * | 138.46 | -13.09 | 213.19 | -13.79 | -74.73 |
(Source – Ministry of Commerce and Trade)
The table shows India’s merchandise trade trend over the years, including exports and imports, and trade balance. Up to 2018-19, the exports and imports increased year after year, while the exports grew by 8.75% and imports by 10.41%, leading to a trade deficit of $183.96 billion. In contrast, in 2019-20, exports and imports suffered a decline at 5.06% and 7.66%, respectively. On that account, the trade deficit declined to $161.35 billion. The COVID-19 pandemic during the year 2020-21 has further resulted in reduced exports(-6.88%) and more significant drops in imports (-16.92 %), which resulted in a trade deficit of $102.63 billion. After the pandemic, the recovery was very good during 2021-22, in which the exports increased by 44.58% along with 55.31% of imports, and thus the trade deficit increased to $190.72 billion. In 2022-23, export growth declined to 6.74 percent. Imports are again rising faster, at 16.47 percent, causing the trade deficit to reach an all-time high of $263.61 billion. In the first four months of the current 2023-24 fiscal report exports (-13.09%) and imports (-13.79%) declined in the same period over the last fiscal year could well be evidence of weaker demand for abroad or home-based-economic corrections. India’s trade balance remains in deficit because imports are consistently higher than exports, and global economic conditions and domestic policies play a role in determining trade performance.
India’s Export Growth Over the Years-
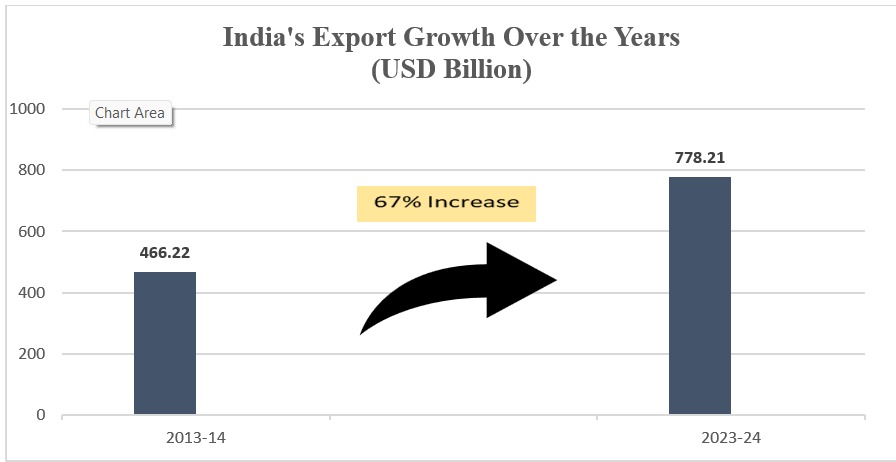
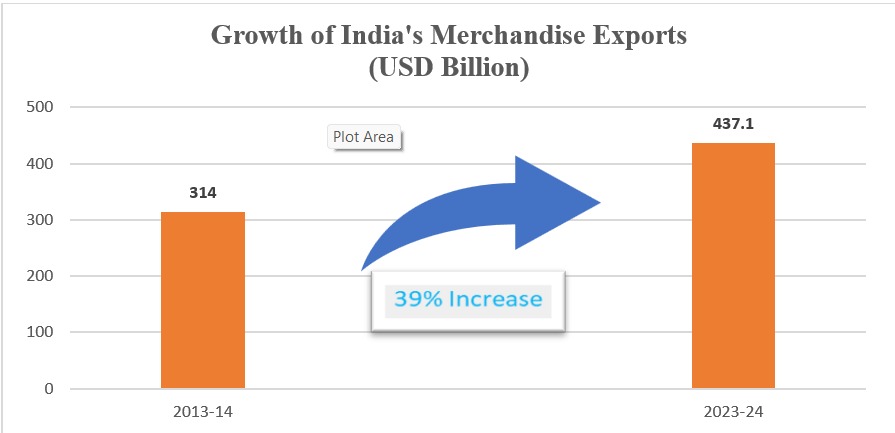
India’s exports have seen a historic rise, reaching USD 778.21 billion in 2023-24. This marks a 67% increase from USD 466.22 billion in 2013-14. The growth reflects India’s expanding role in global trade, driven by strong performances in both merchandise and services exports.
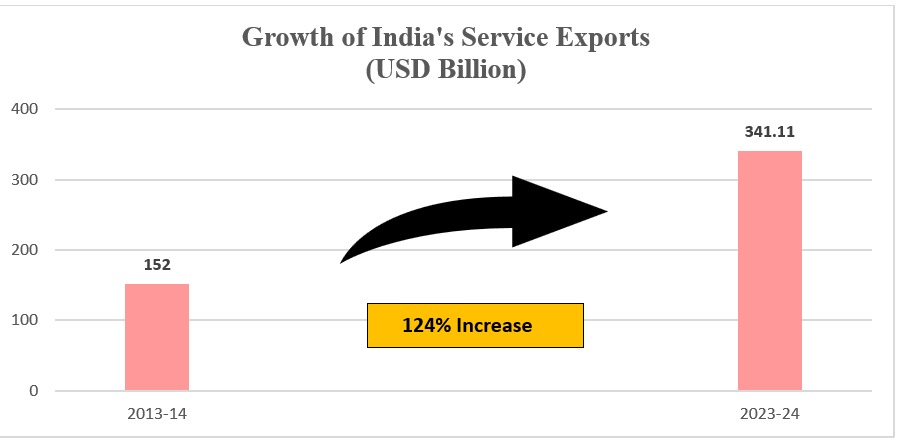
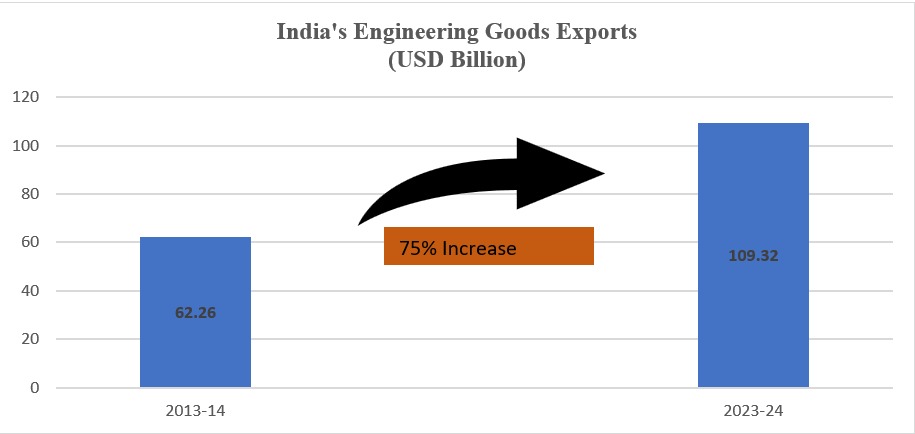
In 2023-24, merchandise exports stood at USD 437.10 billion, while services exports contributed USD 341.11 billion, demonstrating a well-balanced expansion. Key sectors like electronics, pharmaceuticals, engineering goods, iron ore, and textiles played a vital role in this surge. Strengthened by strategic policy measures, enhanced competitiveness, and broader market access, India’s export ecosystem is now more resilient and deeply integrated into the global economy.
(Source – PIB Government of India)
(Source – PIB Government of India)
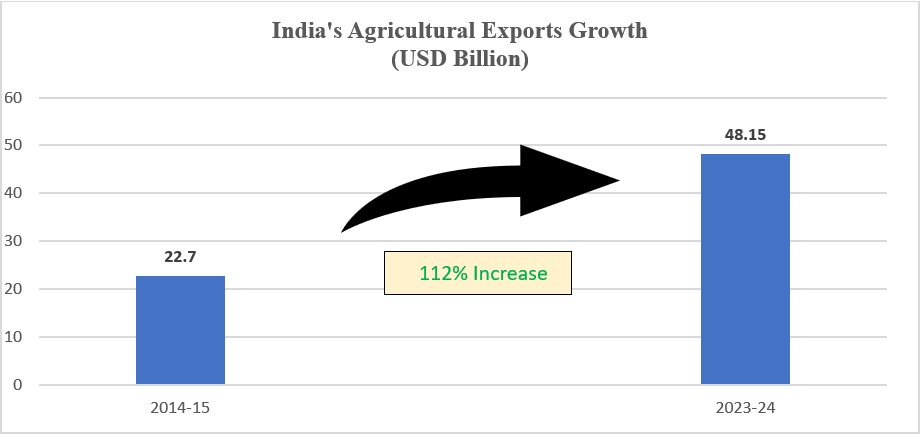
| 124% Increase |
(Source – PIB Government of India)
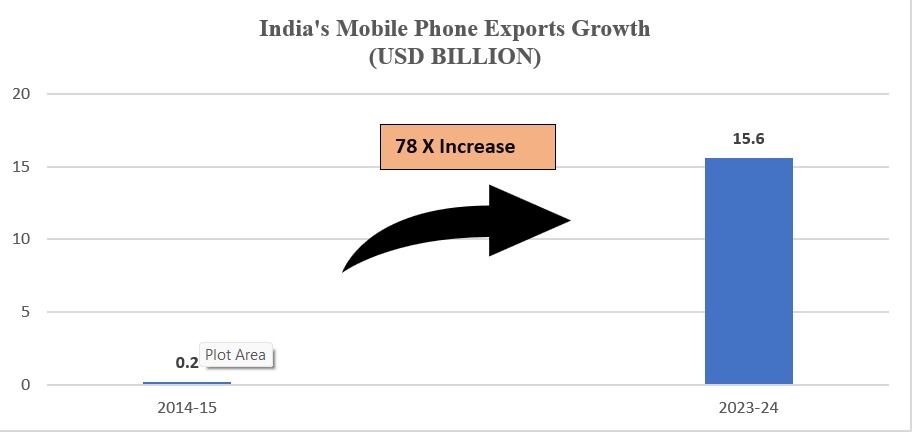
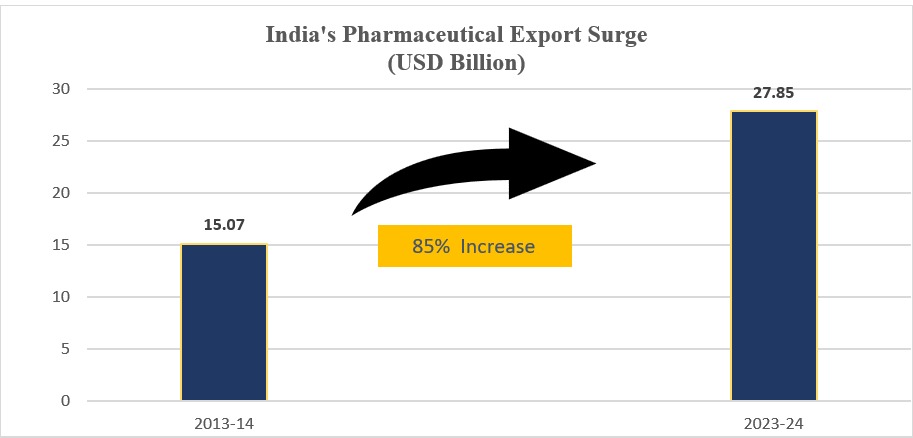
Sectoral Growth in India’s Exports
| 78 X Increase |
 (Source – PIB Government of India)
(Source – PIB Government of India)
(Source – PIB Government of India)
(Source – PIB Government of India)
(Source – PIB Government of India)
Leading Export Regions over the Years
In 2004-05, India’s exports were predominantly directed to regions like North America, the European Union, North-East Asia, West Asia-Gulf Cooperation Council, and ASEAN. By 2013-14, there was a marked increase in export values across these regions, with North America, the EU, and West Asia seeing notable growth. Fast forward to 2023-24, and the export landscape shows continued expansion, with North America leading as the largest destination. The EU, West Asia, and ASEAN also experienced robust growth, illustrating India’s diversified and strengthened global trade relationships over the years.
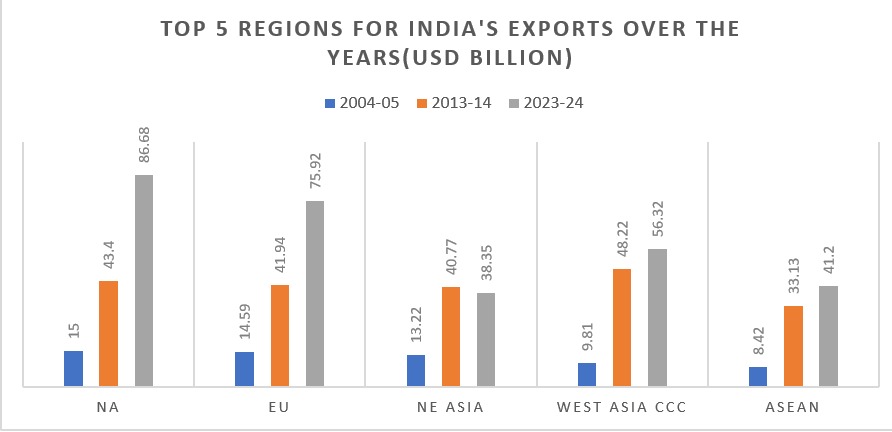
(Source – PIB Government of India)
Composition of Trade:
International trade in India has undergone many changes since independence. Over time, the share of non-traditional goods in total exports has increased consistently. India’s export basket now includes a significant part of chemical and engineering goods, which have shown high growth rates. Recently, handicrafts, including gems and jewellery, have become prominent export items. Along with these, India continues to export traditional goods like tea, coffee, rice, pulses, spices, tobacco, jute and iron ore.
India’s Exports (Principal Commodity wise) in the last 5 years is as follows:
(Values in USD million)
| Commodity | FY 2019- 2020 | FY 2020- 2021 | FY 2021- 2022 | FY 2022- 2023 | FY 2023- 2024 |
| Readymade Garment | 15488 | 12272 | 16015 | 16191 | 14532 |
| Cotton Textiles | 10263 | 11128 | 17166 | 11085 | 12258 |
| Man-made textiles | 5324 | 4180 | 6294 | 5412 | 5081 |
| Wool & Woolen textiles | 181 | 109 | 166 | 205 | 192 |
| Silk Products | 72 | 76 | 109 | 95 | 119 |
| Handloom Products | 319 | 223 | 269 | 183 | 140 |
| Carpets | 1373 | 1491 | 1790 | 1366 | 1395 |
| Jute Products | 357 | 397 | 537 | 462 | 353 |
| Total Textile & Apparel | 33379 | 29877 | 42347 | 34997 | 34072 |
| Handicrafts | 1798 | 1708 | 2088 | 1689 | 1802 |
| Total T&A including Handicrafts357 | 35177 | 31585 | 44435 | 36686 | 35874 |
(Source: DGCI&S (Provisional)
The Indian textile and apparel sector has undergone immense fluctuations over the last five years. There was a sharp reduction in exports in FY 2020-21 on account of the COVID-19 pandemic. However, there was a strong rebound in FY 2021-22. There has been a downtrend over the last two years, likely due to weaker demand globally, changing trade policies, and increased competition from other textile-exporting countries. Cotton and readymade garments remain key contributors, while categories like handloom, jute, and wool continue to struggle. Moving forward, policy support, market diversification, and sustainable production practices could help boost the sector’s export performance.
CHALLENGES FACED BY FOREIGN TRADE OF INDIA
India has been showing some active endeavours toward boosting foreign trade lately. To be more supportive of it, multiple reforms and schemes have been enforced recently. Although efforts are visible, India suffers great rejections in the overseas market.
At the moment, global protectionism, increasing tariff and non-tariff barriers, an ongoing global economic slowdown, and increasing use of even lesser-known mechanisms are stalling free trade and multilateral agreements such as the long-pending Free Trade Agreement with the European Union, and unfavourable foreign trade policies. The manufacturing sector in India has not been able to grow and the country still largely survives on services trade, which is inherently volatile. Hence, the manufacturing sector needs to gear up for greater participation in the evolving global trade environment
Over the past few years, India has witnessed a growing trend of its trading partners imposing various tariff and non-tariff barriers. These measures are often taken to protect or promote domestic industries, service providers, or intellectual property at the expense of imported goods, services, and foreign-owned innovations. For instance, such barriers are justified on the grounds of protecting consumer and animal health. However, in some cases, they work as disguised trade restrictions that cause an uneven playing field between domestic and foreign entities. Such distortions in trade barriers affect the dynamics of foreign trade in India. A deeper analysis of ETI reveals that India’s important import duties impact its international trade negatively. High tariffs, in some ways, also limit Indian exports to gain access to a foreign market.
1) Tariff and Non-Tariff Barriers:
India is currently facing many tariff and non-tariff barriers that restrict the smooth flow of goods and services in international trade. Tariff barriers include increased import duties as per Article II of the GATT. In contrast, non-tariff barriers include measures such as import licensing, stringent standards, testing requirements, labeling and certification norms, anti-dumping duties, countervailing measures, export subsidies, and domestic support policies. Many countries use these non-tariff barriers to impose restrictions on Indian goods, limiting their access to foreign markets.
2) Global Economic Crisis:
The global financial crisis of 2008-2009, triggered by the U.S. subprime mortgage crisis and the subsequent EU economic downturn in 2009, had a severe impact on Indian exports. Key industries such as gems & jewelry, readymade garments, and handicrafts witnessed a decline in demand and prices, negatively affecting Indian exporters’ revenues and overall trade balance.
3) Reduction in Export Incentives:
The Indian government has recently reduced export incentives, such as lowering Duty Drawback (DBK) rates and withdrawing income tax benefits for a large number of exporters. This has decreased India’s export competitiveness, as higher costs make Indian products less attractive in global markets.
4) Stringent Product Standards:
Developed nations have been imposing stricter product quality and safety standards on imports from developing countries like India. Exporters must conduct multiple laboratory tests to meet these requirements, significantly increasing costs. This, in turn, reduces the competitiveness of Indian products in the international market and leads to a decline in exports.
5) Anti-Dumping Duties:
Many developed countries have increased anti-dumping duties on Indian goods in recent years. For example, the USA imposed anti-dumping duties on stainless steel flanges imported from India and China, claiming that both nations were subsidizing their exports. While some of these measures may be justified, they often harm Indian exporters. To address such trade disputes, India must seek resolution through the WTO Dispute Settlement Body. However, until such disputes are resolved, Indian businesses lose opportunities in key markets like the USA.
6) Subsidies by Developed Countries:
Developed economies like the USA and EU provide substantial subsidies to their domestic industries, including fertilizer producers and exporters. This artificially lowers production costs, allowing their products to be sold at competitive prices in the global market. As a result, Indian exporters struggle to compete with subsidized products from these countries.
7) Maritime Piracy Threats:
A significant portion of India’s international trade passes through the Gulf of Aden, a region notorious for pirate attacks. This poses a serious risk to Indian exporters, increasing transportation costs and security concerns.
8) Excessive Export Documentation Requirements:
India’s export process involves an excessive number of documents, creating bureaucratic delays. On average, Indian exporters must complete around 25 different documents to process shipments. Although the government has introduced single-window clearance systems, many small exporters still rely on traditional documentation methods, which slows down trade and adds to costs.
Conclusion-
India’s foreign trade landscape has been transformed since the 1991 economic liberalization, which saw a shift from a highly regulated economy to an increasingly open and globally integrated one. The LPG policies were instrumental in the acceleration of growth in trade, diversification of export baskets, and strengthening of India’s participation in global markets.
Over the years, India’s trade composition has undergone a sea change. The exports have shifted from traditional agricultural and low-value goods to high-value manufacturing and services, especially in IT, pharmaceuticals, and engineering products. Simultaneously, imports have expanded to meet the growing demand for energy, raw materials, and advanced technology. The growth of regional and bilateral trade agreements has shaped the direction of India’s trade further, whereas economic reforms, tariff rationalization, and export promotion schemes have helped enhance competitiveness in trade. Despite these positive trends, India has major issues in terms of foreign trade, such as high deficits in trade balance, dependence on oil imports, global economic shocks, tariff, and non-tariff barriers, and rapidly increasing protectionism in major world economies. The stagnation of multilateral trade negotiations, WTO-trade disputes, and supply chain shock have presented challenges to the Indian external sector. Moreover, India’s manufacturing sector is yet to be a developed sector with the ability to compete with big manufacturing giants worldwide, such as China.
Going forward, India’s strategy for foreign trade must focus on export diversification, enhancement of infrastructure, strengthening manufacturing initiatives such as “Make in India,” negotiation of favorable trade agreements, and mitigation of trade barriers through diplomatic and policy interventions. Domestic production capabilities will be strengthened, along with integration into global value chains and digital trade opportunities, so that sustainable trade growth is guaranteed.
While India has indeed demonstrated tremendous growth in expanding its global trade footprint since 1991, it needs to respond to emerging global challenges, strengthen domestic competitiveness, and pursue strategic trade policies to continue charting its way as a dynamic player in the world economy. The future for India’s foreign trade is innovation, sustainability, and resilience within an ever-changing global trade environment.
References –
- https://wits.worldbank.org/CountryProfile/en/Country/IND/Year/2022/SummaryText
- https://www.jetir.org/papers/JETIR2312755.pdf
- https://www.phdcci.in/file/thematic_pdf/Foreign%20Trade.pdf
- Bhanu Murthy, K. V. and Sinha, Manoj Kumar (2014). Dominance and Competition of Global Outward Foreign Direct Investment, MAIMS Journal of Management, 8(2): 89-102.
- Bhat, T.P (2011). Structural Changes in India’s Foreign Trade. Working Paper, Institute for Studies in Industrial Development, New Delhi.
- Anju (2012), “International Trade in Services in India Implications for growth and Inequality in a Globalising World” The Indian Economic Journal Vol. 59, No. 4
- Gujarati D. N., Basic Econometrics, New York, Mc Graw Hill Book Co., (2015)
- Pillania, R. K. (2008). An Exploratory Study of Indian Foreign Trade, Journal of Applied Economic Science, III, 3(5), 281-292.
- Bhanumurthy, K. V. and Sinha, Manoj Kumar (2014). Dominance and Competition of Global Outward Foreign Direct Investment, MAIMS Journal of Management, 8(2): 89-102.
- Bhanumurthy, K. V. and Sinha, Manoj Kumar (2011). Dominance and Concentration of FDI: A Cross Country Analysis, Paper presented at the annual money and finance Conference, IGIDR, Mumbai, 25-26 February.
- Bhanumurthy, K.V. and Deb, A. T. (2008). Operationalizing and Measuring Competition: Determinants of Competition in Private Banking Industry in India. Paper presented in annual money and finance Conference, IGIDR, Mumbai, 18-19 January.
- Bhat, T.P (2011). Structural Changes in India’s Foreign Trade. Working Paper, Institute for Studies in Industrial Development, New Delhi.
- Bodenhorn, H. (1990). Entry, Rivalry and Free Banking. Review of Economics and Statistics, 72(4): 682 86.